File:Sinc function (normalized).svg
Jump to navigation
Jump to search

Size of this PNG preview of this SVG file: 800 × 549 pixels. Other resolutions: 320 × 220 pixels | 640 × 439 pixels | 1,024 × 703 pixels | 1,280 × 878 pixels | 2,560 × 1,756 pixels | 908 × 623 pixels.
Original file (SVG file, nominally 908 × 623 pixels, file size: 4 KB)
Summary
| Description |
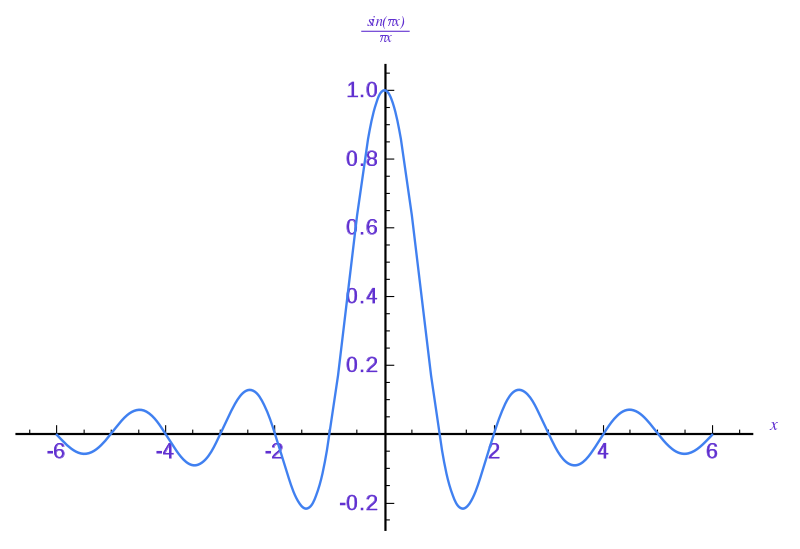
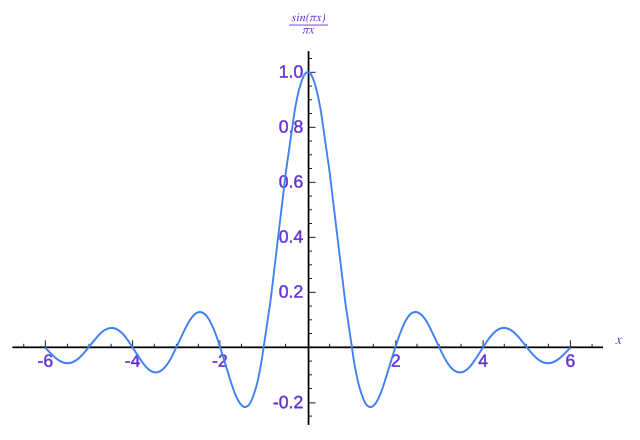
English: Graph of the normalized sinc function sin(πx)/(πx).
The original was generated by gnuplot, while the more recent one was generated with matplotlib. File size was reduced by efficient coding of the axis drawing and labeling and by a reworking of the graph's path. The resulting path is smoother even though fewer points are used in its determination.This 1081 was created with a text editor.  Please do not replace the simplified code of this file with a version created with Inkscape or any other vector graphics editor Omegatron's instructions: This plot was created with Gnuplot. |
| Date | 22 May 2006 (upload date) |
| Source | Own work |
| Author | Omegatron |
| Other versions |
|
| gnuplot source | click to expand
# Set 1300×975 SVG output and filename
# The font size (fsize) sets the size for the circles, too.
set samples 400
set terminal svg enhanced size 1300 975 fname "Times" fsize 36
set output "sinc function (normalized).svg"

# Set y axis limits so the plot doesn't go right to the edges of the graph
set yrange [-0.3:1.1]
set xrange [-6:6]

set lmargin 5
set bmargin -5

# No legend needed
set nokey

# Add lightly-colored axis lines
set yzeroaxis
set xzeroaxis

# Put a y-axis tic at every 0.2
set ytics 0.2
set mytics 4

# Format tics as digit with one decimal place
set format y "%2.1f"

# Put an x-axis tic at every integer
set xtics 1
set format x "%2.0f"
set mxtics 5

# Plot as lines
plot sin(pi*x)/(pi*x) with lines

# Close the file (so I don't have to close gnuplot to view it)
set output
|
.svg)
.svg)
.svg)
.svg)
Licensing
I, the copyright holder of this work, hereby publish it under the following licenses:
This file is licensed under the Creative Commons Attribution-Share Alike 3.0 Unported, 2.5 Generic, 2.0 Generic and 1.0 Generic license.
- You are free:
- to share – to copy, distribute and transmit the work
- to remix – to adapt the work
- Under the following conditions:
- attribution – You must give appropriate credit, provide a link to the license, and indicate if changes were made. You may do so in any reasonable manner, but not in any way that suggests the licensor endorses you or your use.
- share alike – If you remix, transform, or build upon the material, you must distribute your contributions under the same or compatible license as the original.

|
Permission is granted to copy, distribute and/or modify this document under the terms of the GNU Free Documentation License, Version 1.2 or any later version published by the Free Software Foundation; with no Invariant Sections, no Front-Cover Texts, and no Back-Cover Texts. A copy of the license is included in the section entitled GNU Free Documentation License. |
You may select the license of your choice.
File history
Click on a date/time to view the file as it appeared at that time.
| Date/Time | Thumbnail | Dimensions | User | Comment | |
|---|---|---|---|---|---|
| current | 11:42, 6 April 2012 | | 908 × 623 (4 KB) | wikimediacommons>Aflafla1 | Compressed Version - Sinc path computed, rest hand coded |
File usage
The following page uses this file:
.svg)