File:Shepard interpolation 1 dimension.png
Jump to navigation
Jump to search

Size of this preview: 800 × 321 pixels. Other resolutions: 320 × 128 pixels | 1,152 × 462 pixels.
Original file (1,152 × 462 pixels, file size: 38 KB, MIME type: image/png)
Summary
| Description |
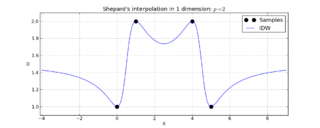
English: This is a result from the shepard method applied to a 1 dimension function. |
| Date | |
| Source |
At IST (Lisbon, PT) with ubuntu+python+numpy+matplotlib This plot was created with Matplotlib. |
| Author | Fmafunenga |
Licensing
I, the copyright holder of this work, hereby publish it under the following licenses:

|
Permission is granted to copy, distribute and/or modify this document under the terms of the GNU Free Documentation License, Version 1.2 or any later version published by the Free Software Foundation; with no Invariant Sections, no Front-Cover Texts, and no Back-Cover Texts. A copy of the license is included in the section entitled GNU Free Documentation License. |
This file is licensed under the Creative Commons Attribution-Share Alike 3.0 Unported license.
- You are free:
- to share – to copy, distribute and transmit the work
- to remix – to adapt the work
- Under the following conditions:
- attribution – You must give appropriate credit, provide a link to the license, and indicate if changes were made. You may do so in any reasonable manner, but not in any way that suggests the licensor endorses you or your use.
- share alike – If you remix, transform, or build upon the material, you must distribute your contributions under the same or compatible license as the original.
You may select the license of your choice.
Source code
The python code (numpy archive copy at the Wayback Machine, matplotlib) used to create this image:
import numpy as np
import matplotlib.pyplot as plt

def weight( pointA, pointB ):
	p = 2.0 #this is the power parameter
	rst = ( 1.0/( abs(pointA-pointB)**p ) )
	return rst

def idw( xi, ui ):
	xidw = np.arange(-4.0, 9.0, 0.01)
	uidw = np.arange(-4.0, 9.0, 0.01)
	for idx in range(len(xidw)):
		denum = 0.0 ; num = 0.0
		for i in range(len(xi)):
			w      = weight( xidw[idx], xi[i] )
			denum += w
			num   += w*ui[i]
		uidw[idx] = num / denum
	return xidw, uidw

if __name__ == "__main__":
	xi = [0.0, 1.0, 4.0, 5.0]
	yi = [1.0, 2.0, 2.0, 1.0]
	xidwr, yidwr = idw( xi, yi )

	plt.plot( xi, yi, "ok",ms=10, lw=2, label="Samples" )
	plt.plot( xidwr, yidwr, "-", label="IDW" )
	plt.title( r"Shepard's interpolation in 1 dimension: $p=2$" )
	plt.xlim((-4.1,9.1)) ; plt.xlabel(r"X")
	plt.ylim((0.9,2.1)) ; plt.ylabel(r"U")
	plt.legend() ; plt.grid() ; plt.show()
File history
Click on a date/time to view the file as it appeared at that time.
| Date/Time | Thumbnail | Dimensions | User | Comment | |
|---|---|---|---|---|---|
| current | 02:45, 10 May 2012 | 1,152 × 462 (38 KB) | wikimediacommons>Fmafunenga | {{subst:Upload marker added by en.wp UW}} {{Information |Description = {{en|This is a result from the shepard method applied to a 1 dimension function.}} |Source = At IST (Lisbon, PT) with ubuntu+python+numpy+matplotlib |Date = 2012-05-10 |Author = [[U... |
File usage
There are no pages that use this file.