File:CriticalFrequencyAliasing.svg
Jump to navigation
Jump to search

Size of this PNG preview of this SVG file: 600 × 480 pixels. Other resolutions: 300 × 240 pixels | 960 × 768 pixels | 1,280 × 1,024 pixels | 2,560 × 2,048 pixels.
Original file (SVG file, nominally 600 × 480 pixels, file size: 22 KB)
Summary
| Description |
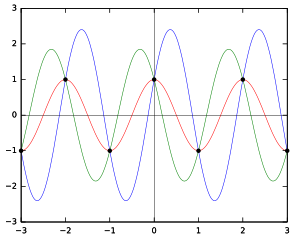
English: Plot of some sinusoids with the critical frequency (one half cycle per sample), all having samples alternating between +1 and -1 at integer values of t/T. |
| Date | |
| Source | Created from scratch with gnuplot, based on idea from original bitmap version |
| Author | Qef |
| Other versions |
|
The 'CriticalFrequencyAliasing.points' file contains the following:
Finally, after running Gnuplot I post-processed the image with 'sed' to tweak the axis labels, changing hyphens to real minus signs:
sed 's/<text>-/<text>\xE2\x88\x92/g' <input.svg >output.svg
Licensing
| I, the copyright holder of this work, release this work into the public domain. This applies worldwide. In some countries this may not be legally possible; if so: I grant anyone the right to use this work for any purpose, without any conditions, unless such conditions are required by law. |
File history
Click on a date/time to view the file as it appeared at that time.
| Date/Time | Thumbnail | Dimensions | User | Comment | |
|---|---|---|---|---|---|
| current | 20:53, 1 July 2008 | | 600 × 480 (22 KB) | wikimediacommons>Qef | {{Information |Description={{en|1=Plot of some sinusoids with the critical frequency (one half cycle per sample), all having samples alternating between +1 and -1 at integer values of t/T.}} |Source=Created from scratch with gnuplot, based on idea from or |
File usage
There are no pages that use this file.