File:Bernoulli inequality.svg
Jump to navigation
Jump to search

Size of this PNG preview of this SVG file: 254 × 488 pixels. Other resolutions: 125 × 240 pixels | 250 × 480 pixels | 399 × 768 pixels | 533 × 1,024 pixels | 1,066 × 2,048 pixels.
Original file (SVG file, nominally 254 × 488 pixels, file size: 18 KB)
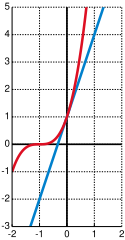
| Description | Illustration of Bernoulli's inequality. |
| Date | (UTC) |
| Source | self-made with MATLAB |
| Author | Oleg Alexandrov |
| SVG development | |
| Source code | MATLAB code% Illustration of the bernoulli inequality
function main()
r = 3; % the power in the Bernoulli inequality
% KSmrq's colors
red = [0.867 0.06 0.14];
blue = [0, 129, 205]/256;
green = [0, 200, 70]/256;
yellow = [254, 194, 0]/256;
white = 0.99*[1, 1, 1];
% Set up the grid and other parameters
N = 100;
A = -2; B = 2;
X = linspace(A, B, N);
Y1 = 1+r*X;
Y2 = (1+X).^r;
C=-3; D = 5;
% Set up the figure
lw = 3; % linewidth
fs = 12; % font size
figure(1); clf;
set(gca, 'fontsize', fs);
set(gca, 'linewidth', 0.4*lw)
hold on;% grid on;
plot_axes (A, B, C, D, lw/1.5);
plot(X, Y1, 'color', blue, 'linewidth', lw);
plot(X, Y2, 'color', red, 'linewidth', lw);
axis equal; axis([A, B, C, D]);
set(gca, 'XTick', [-2, -1, 0, 1, 2]) % text labels on the x axis
grid on;
saveas(gcf, 'Bernoulli_inequality.eps', 'psc2'); % save as eps
%plot2svg('Bernoulli_inequality.svg'); % save as svg
function plot_axes (A, B, C, D, lw)
black = [0, 0, 0];
plot([A B], [0, 0], 'linewidth', lw, 'color', black);
plot([0, 0], [C, D], 'linewidth', lw, 'color', black);
|
| I, the copyright holder of this work, release this work into the public domain. This applies worldwide. In some countries this may not be legally possible; if so: I grant anyone the right to use this work for any purpose, without any conditions, unless such conditions are required by law. |
File history
Click on a date/time to view the file as it appeared at that time.
| Date/Time | Thumbnail | Dimensions | User | Comment | |
|---|---|---|---|---|---|
| current | 08:11, 9 January 2008 | | 254 × 488 (18 KB) | wikimediacommons>Oleg Alexandrov | {{Information |Description=Illustration of Bernoulli's inequality. |Source=self-made with MATLAB |Date=~~~~~ |Author= Oleg Alexandrov |Permission= |other_versions= }} {{PD-self}} ==Source code ([[: |
File usage
There are no pages that use this file.