File:Acf new.svg
Jump to navigation
Jump to search

Size of this PNG preview of this SVG file: 217 × 289 pixels. Other resolutions: 180 × 240 pixels | 360 × 480 pixels | 577 × 768 pixels | 769 × 1,024 pixels | 1,538 × 2,048 pixels.
Original file (SVG file, nominally 217 × 289 pixels, file size: 35 KB)
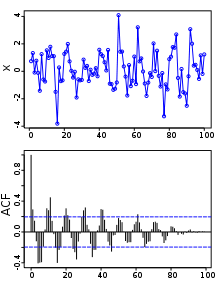
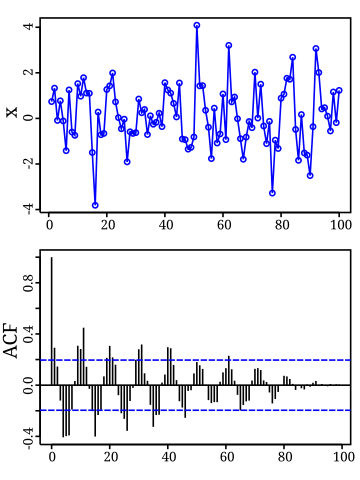
| Description | An image of random numbers, with a hidden sine function, with a wavelength every 10 units. The bottom image shows the autocorrelation. Made using R; minor edit for dashed line in bottom figure using Inkscape. |
| Date | (UTC) |
| Source | |
| Author | |
| SVG development | |
| Source code | R codelibrary(RSvgDevice)
x <- rnorm(100) + sin(2*pi*1:100/10)
devSVG("acf.pdf", width=3, height=4)
par(mfrow=c(2,1), mar=c(3.5, 3.5, 0.5, 0.5), mgp=c(2, 0.8, 0), cex=.7)
plot(x, type="o", col="blue", main=NA)
acf(x, 100, main=NA)
dev.off()
|
I, the copyright holder of this work, hereby publish it under the following licenses:
This file is licensed under the Creative Commons Attribution-Share Alike 2.5 Generic, 2.0 Generic and 1.0 Generic license.
- You are free:
- to share – to copy, distribute and transmit the work
- to remix – to adapt the work
- Under the following conditions:
- attribution – You must give appropriate credit, provide a link to the license, and indicate if changes were made. You may do so in any reasonable manner, but not in any way that suggests the licensor endorses you or your use.
- share alike – If you remix, transform, or build upon the material, you must distribute your contributions under the same or compatible license as the original.
| This file is licensed under the Creative Commons Attribution-Share Alike 3.0 Unported license. Subject to disclaimers. | ||
| ||
| This licensing tag was added to this file as part of the GFDL licensing update. |

|
Permission is granted to copy, distribute and/or modify this document under the terms of the GNU Free Documentation License, Version 1.2 or any later version published by the Free Software Foundation; with no Invariant Sections, no Front-Cover Texts, and no Back-Cover Texts. A copy of the license is included in the section entitled GNU Free Documentation License. Subject to disclaimers. |
You may select the license of your choice.
Original upload log
This image is a derivative work of the following images:
- File:Acf.svg licensed with Cc-by-sa-2.5,2.0,1.0, GFDL-en
- 2007-07-09T23:15:23Z Mwtoews 217x289 (50931 Bytes) == Summary == An image of random numbers, with a hidden [[sine]] function, with a wavelength every 10 units. The bottom image shows the [[autocorrelation]]. Made by [[User:Mwtoews]] using the [[R programming language]]: li
Uploaded with derivativeFX
File history
Click on a date/time to view the file as it appeared at that time.
| Date/Time | Thumbnail | Dimensions | User | Comment | |
|---|---|---|---|---|---|
| current | 23:51, 30 June 2009 | | 217 × 289 (35 KB) | wikimediacommons>Jrmanning | {{Information |Description=An image of random numbers, with a hidden sine function, with a wavelength every 10 units. The bottom image shows the autocorrelation. Made using R: <pre> library |
File usage
There are no pages that use this file.